Tree Equity Score Location Insights
UX/UI Design · Data Viz · Typescript/TailwindCSS
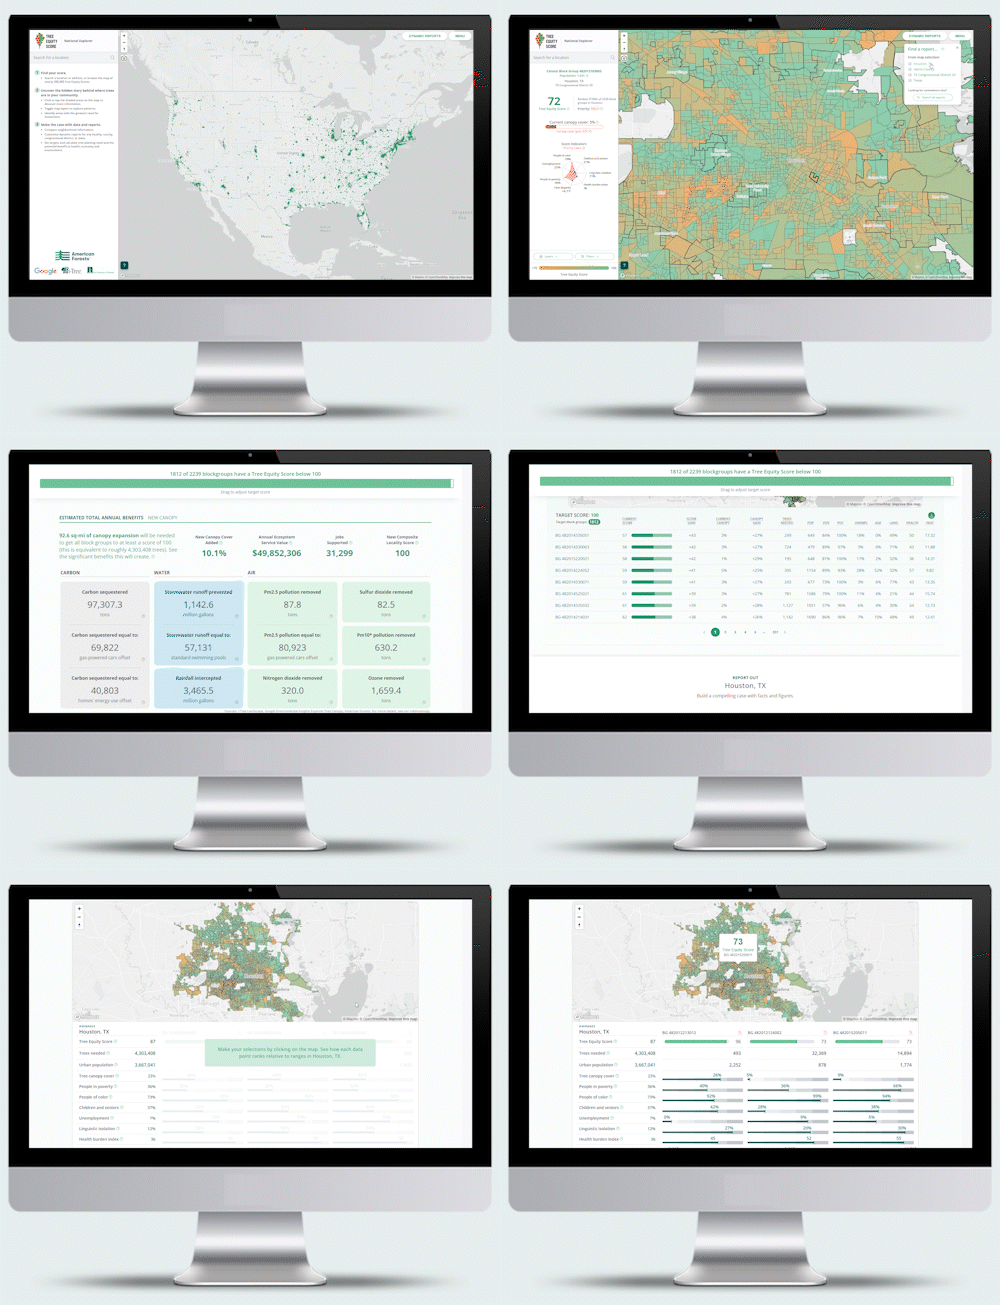
Tree Equity Score has always provided summary reports at different geographic scales. In 2024, we received funding from Google that gave me the opportunity to lead an exciting project to overhaul our reports to provide deeper insights and more flexibility to our users. I started with user research, conducting interviews to understand what capabilities and data insights could help users do their work more effectively. I dug deep into the data, looking for new insights and testing ways to visualize information that aligned with the capabilities users wanted. I took my team through several rounds of design and beta testing — asking questions and stress-testing ideas. My goal was to balance new features within the structure of the existing reports, to introduce change without losing familiar and useful elements. This ambitious project was contained to a 6 month timeline — much of the process focused on identifying high-impact changes that were feasible within budget and time constraints. I created super detailed figma designs for each section of the report — laying out all the variables used, formulas, responsive views, and providing the different states for different geographic scales (locality, county, congressional district, and state). Once the developers built each section, I got into the code to tighten up the styling. Our users are loving the results!


